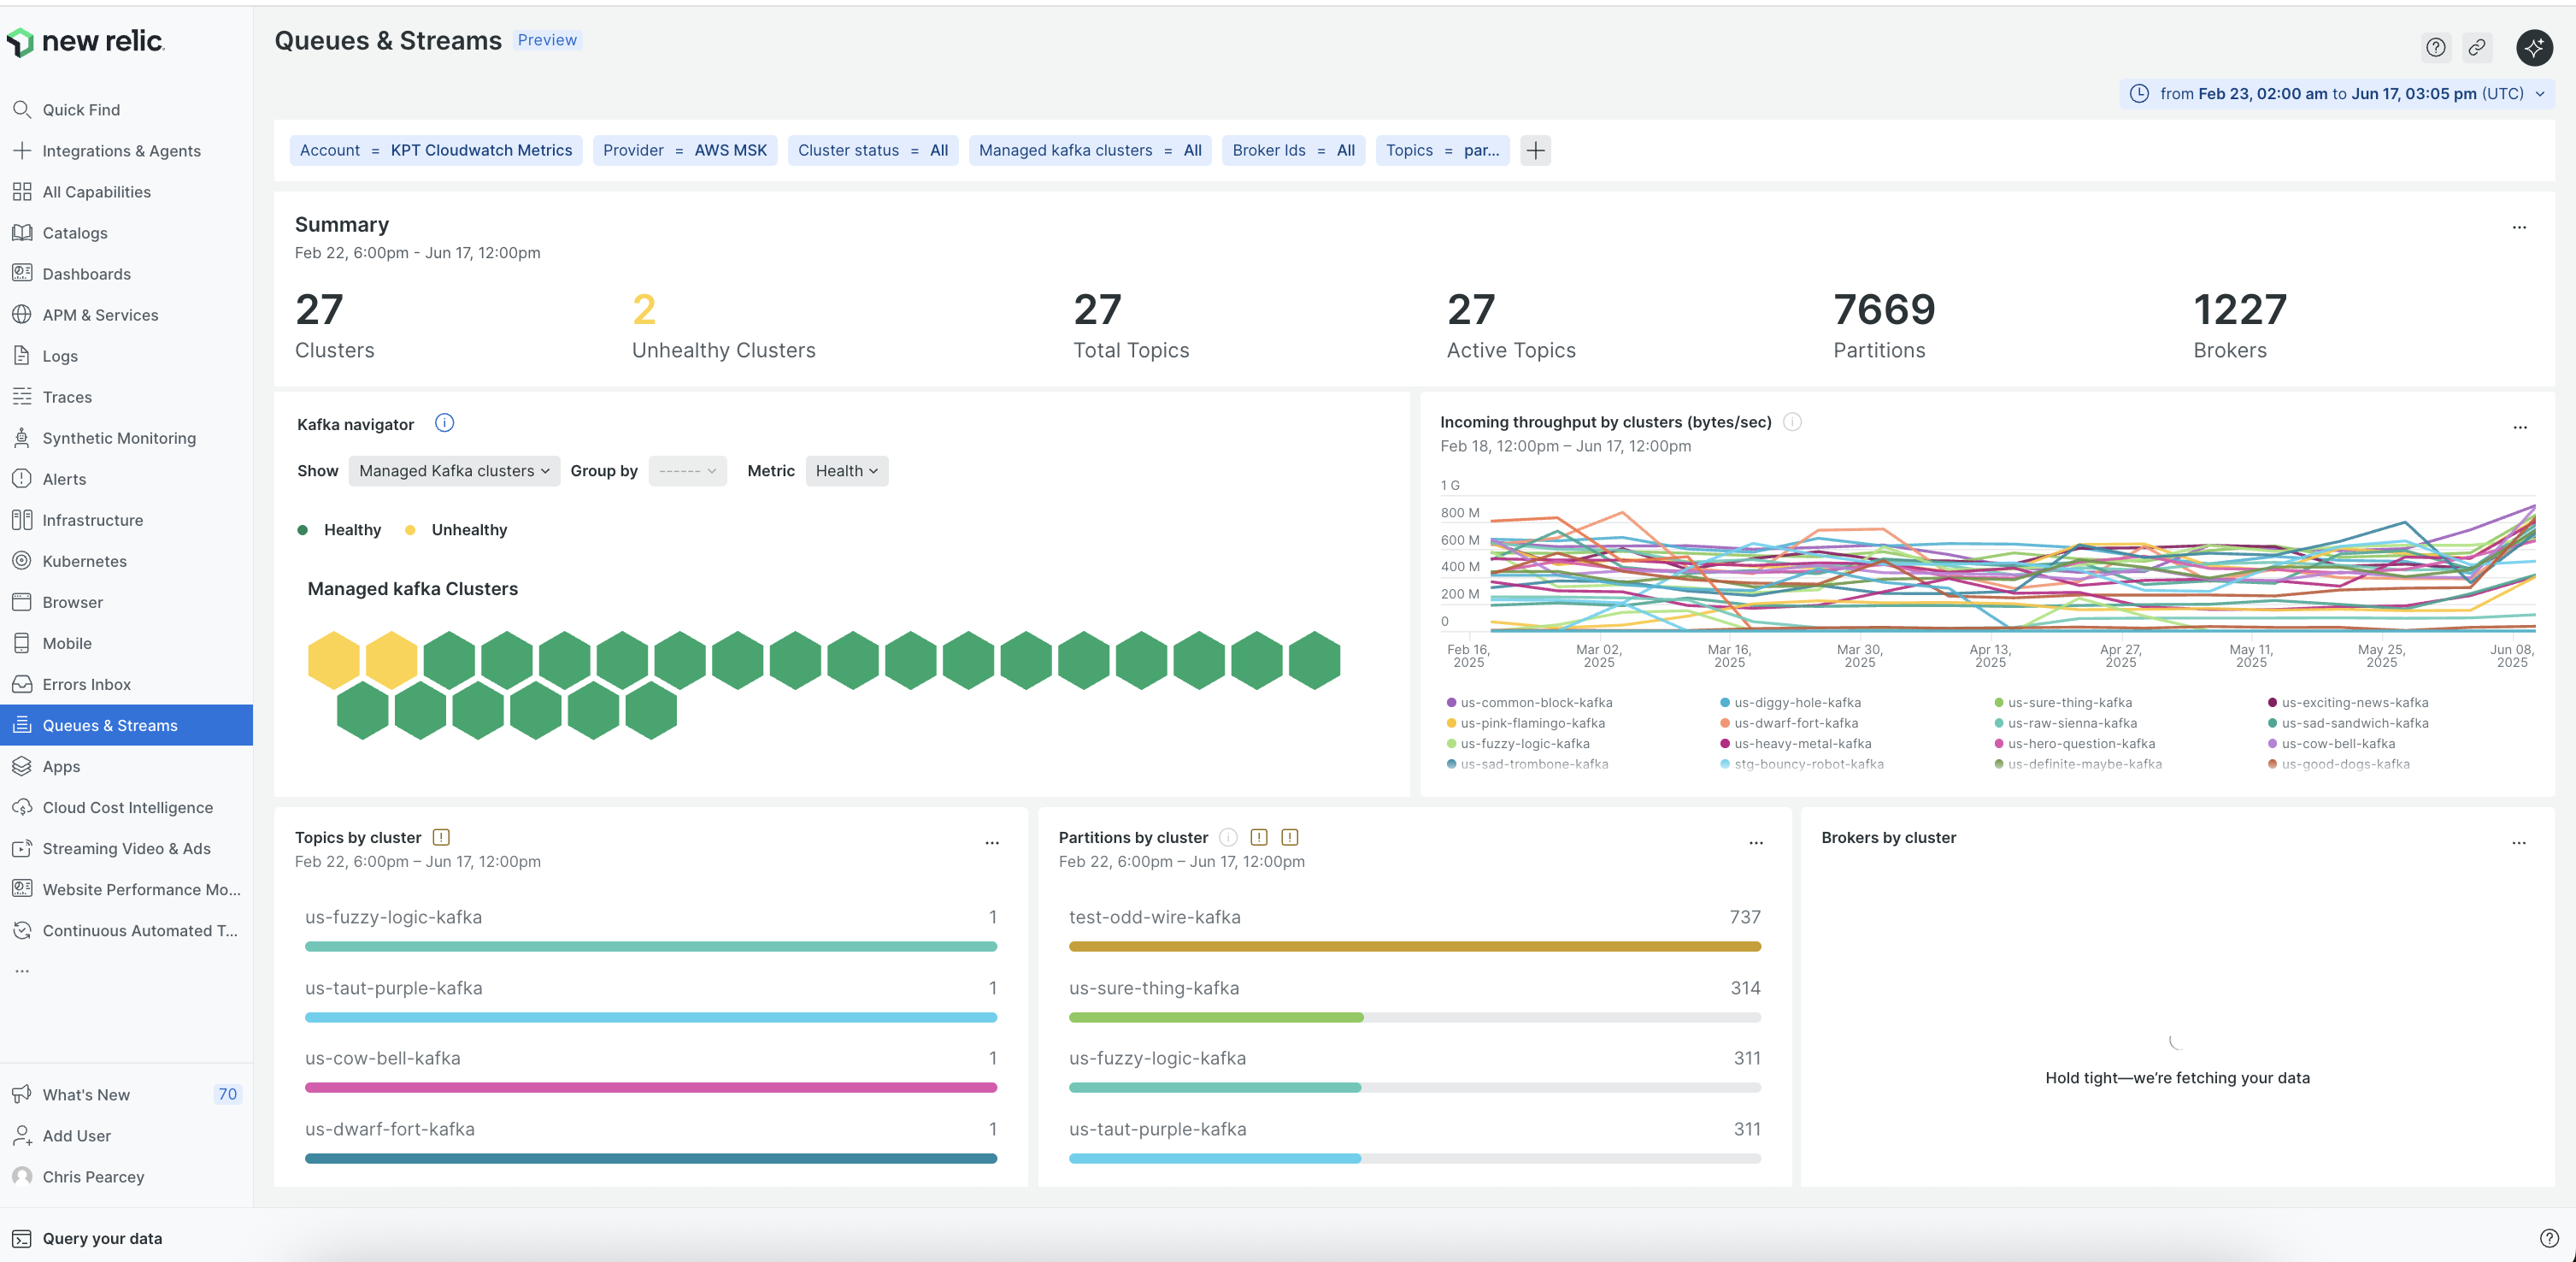
New Relic’s Queues and Streams Monitoring provides engineering and operations teams with a unified, low-to-no-code solution to monitor, troubleshoot, and optimize data pipelines across Kafka, RabbitMQ, Amazon Kinesis, and other platforms.
Message queues and streaming services are foundational to modern, event-driven architectures—but they’ve historically been hard to monitor. Gaps in visibility can lead to silent bottlenecks, delayed processing, and undetected data loss. With New Relic, you now have real-time observability across your entire streaming stack—all in one place.
What Makes Queues and Streams Monitoring Unique:
- Full-topology visibility: Map every cluster, broker, topic, and consumer group with drill-down navigation.
- Root cause clarity: Correlate queue issues with downstream services for faster resolution.
- Lag and throughput tracking: Detect consumer lags, throughput drops, and partition-level latency in real time.
- No code changes needed: Start monitoring without modifying producers, consumers, or pipelines.
- Streamlined setup: Get started with minimal configuration across cloud and on-prem systems.

Learn more in our blog posts and documentation: